IATI Insights - a new visualisation service
This post was written by Thea Schepers, Data Analyst for Plan International Netherlands and IATI consultant for Flores.nl, an Amsterdam-based IT business.
A while ago, my colleagues in Plan International Netherlands, where I work as a database admin and data analyst, asked me to build a management dashboard for an alliance that Plan is in charge of. I had made dashboards using Power BI before, but this was a different beast: the alliance consisted of five partner organisations, all run in very different ways, all using different project management systems - or no project management system at all. Together they were the Yes I Do Alliance, a five year programme in nine countries, battling teen pregnancies, child marriage and FGM. A management report of this scale seemed like a challenge.
Luckily, we had IATI. The alliance was funded by the Dutch government, so IATI was a donor requirement, and all their data was already available in the IATI Standard format. I could use this as a source for my report and all would be well.
In fact everything went really well. We were on a tight deadline and I had not worked with xml files before, so I teamed up with Flores.nl, an IT company I have known for years, and together we made an effective dashboard in Power BI that is now used by the alliance. It has been a steep learning curve, but I’m very proud of the result.
However, we decided we could do much better. This dashboard was custom made for one consortium, and we spent a total of about fifteen working days to get it to work. For every new alliance, we’d have to do that again. Plus, not every organisation has a dedicated data analyst, with the time to work on dashboards like this. And of course, the IATI Standard is updated from time to time.
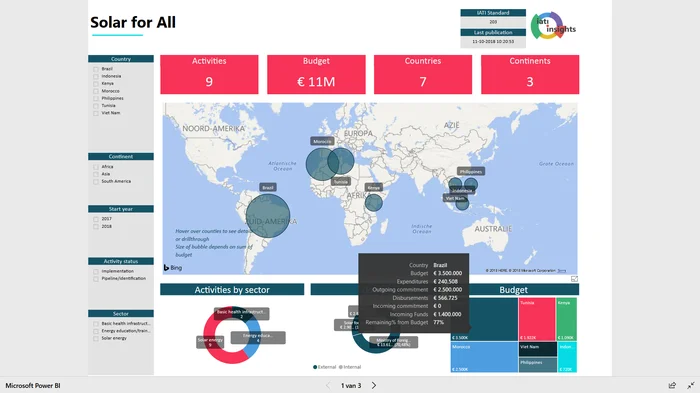
What if we could make a dashboard that would automatically visualise any IATI file? Instead of custom-made Power BI files, we would create an interactive online dashboard, full of visuals for any organisation’s IATI data. This is what we did. We worked on it this summer, and we are convinced it’s better, more interactive, more informative than its predecessor - and prettier. We named it IATI Insights. Organisations contact us, let us know which IATI files to use, and a few days later, the dashboard is ready. No need for a data analyst, no hassle with licenses or software, no training. We guarantee it will always keep up with the latest version of the IATI Standard - and older versions, if you’re a bit behind. And when in future we expand the dashboard to include new visuals, those will be available for all clients.
We made particularly sure that the dashboard works for consortiums and partnerships. After all, those are the situations where IATI can be most useful as a source for a dashboard. In this case, we need the parent activity ID that the alliance lead uses to link to the donor, and the dashboard with only the relevant activities is ready in no time, just like a single organisation dashboard.
A fully functioning demo is available on our website. On Thursday 22 November, we will launch IATI Insights, with some celebratory drinks, in our Amsterdam offices. All IATI publishers are invited, and to prove that IATI Insights will work on any IATI file, we will have a dashboard ready for the organisations of all attendees. We already have a nice group of registrants, so it’s going to be a good afternoon. There is room for a few more, so if you want to join us, let us know by registering here.